Results
|
ACROSS BOTH REGIONS
To test the variances within groups, Non-metric multidimensional scaling (metaMDS) was completed for regions and seasonality. Various packages (dplyr, tidyr, ecodist, vegan, ggplot2) were employed to analyze and visualize the data. Within the two regions, parkland and mixed prairie, differences in pollinator composition did not occur between treatment and control, indicating no apparent treatment effect (Figure 1). However, r^2 was relatively high, suggesting some of the variance in pollinator composition was explained by the model. The statistically significant (p ≤ 0.03) pollinator groups were a genus of bee, Megachile, and flies, Diptera, Syrphidae, and Bombyliidae (Figure 1). After running a perMANOVA, the results suggested there exist potential differences in region not detected by the ordination (perMANOVA p-value=0.005), however, the results also suggested there were no significant differences due to treatment (perMANOVA p-value=0.358). |
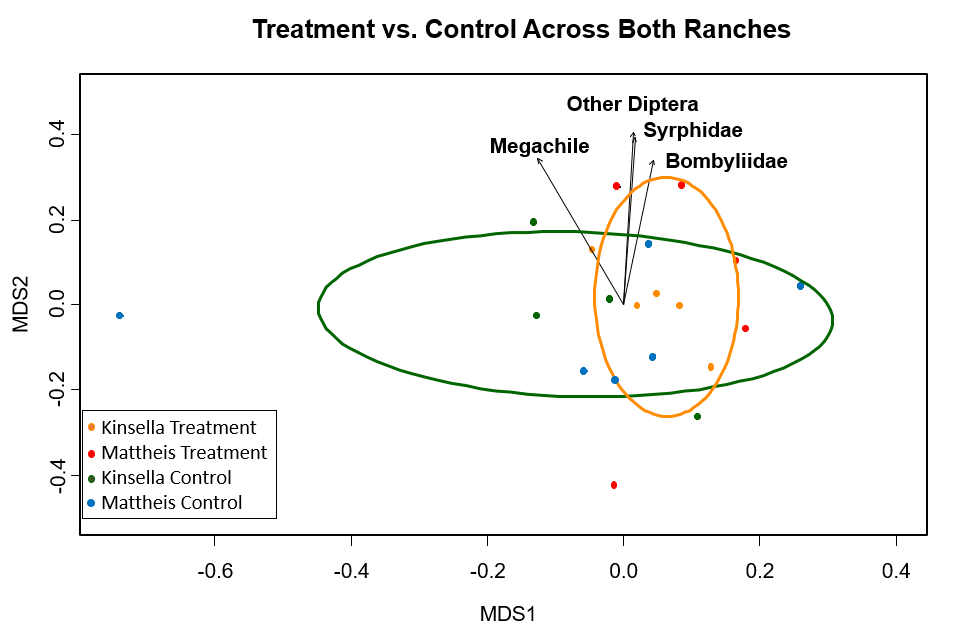
Figure 1. MetaMDS ordination for statistically significant pollinator groups (p ≤ 0.03), clustered by honeybee treatment and control across both regions, where Orange=Honeybee treatment and Green=Control. Each point is a transect. Calculated using the Bray Curtis distance method. Stress value=0.22, r2=0.65.
|
Within the parkland region, differences in pollinator composition did occur between treatment and control (Figure 2). The r^2 was high, indicating some of the variance was explained by the model. The statistically significant (p ≤ 0.03) pollinator groups were flies, Diptera and Syrphidae. The r^2 value was high and the stress level was low for the Kinsella model, showing the data fit the model well (Figure 2).
In comparison, within the mixed prairie region, differences in pollinator composition did not occur between treatment and control (Figure 3). The statistically significant (p ≤ 0.03) pollinator groups were again flies, Diptera and Bombyliidae (Figure 3).
In comparison, within the mixed prairie region, differences in pollinator composition did not occur between treatment and control (Figure 3). The statistically significant (p ≤ 0.03) pollinator groups were again flies, Diptera and Bombyliidae (Figure 3).
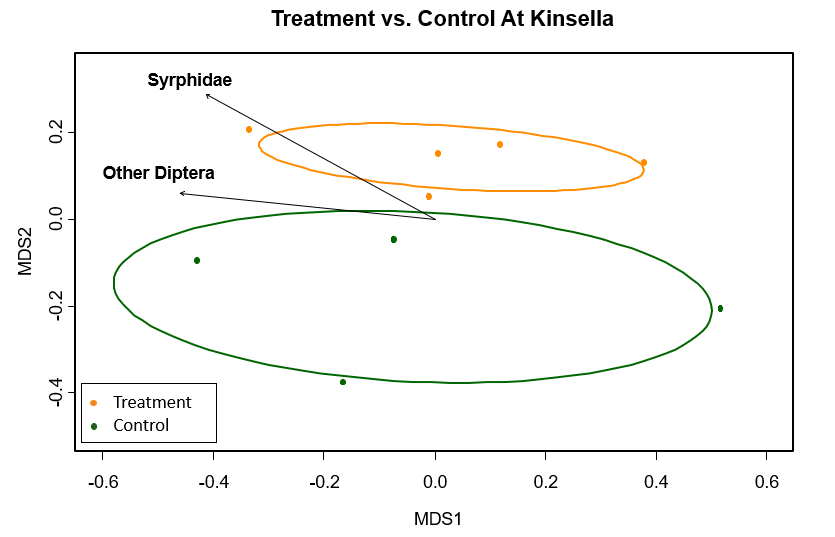
Figure 2. MetaMDS ordination for statistically significant pollinator groups (p ≤ 0.03), clustered by honeybee treatment and control in the parkland biome, where Orange=Honeybee treatment and Green=Control. Each point is a transect from Kinsella. Calculated using the Bray Curtis distance method. Stress value=0.15, r2=0.70.
|
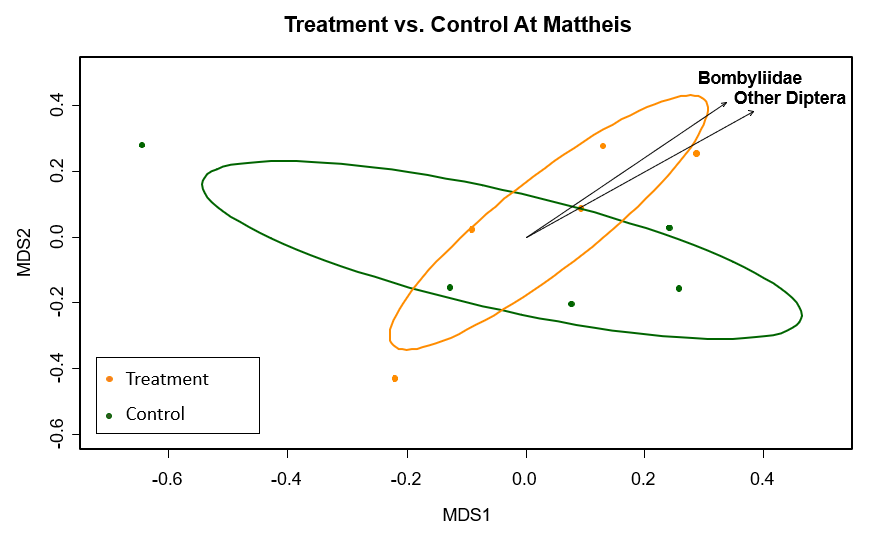
Figure 3. MetaMDS ordination for statistically significant pollinator groups (p ≤ 0.03), clustered by honeybee treatment and control in the mixed grassland biome, where Orange=Honeybee treatment and Green=Control. Each point is a transect from Mattheis. Calculated using the Bray Curtis distance method. Stress value=0.22, r2=0.42.
|
|
ACROSS THE SUMMER SEASON
Across the early summer season, significant differences in pollinator composition did not occur between treatment and control, indicating no apparent treatment effect (Figure 4). The significant (p ≤ 0.03) pollinator groups were flies, Diptera and Syprhidae, ants, Formicidae, and two genera of bee, Lasioglossum and Bombus. The two groups, Lasioglossum and Formicidae, were strongly associated. After running a perMANOVA across all three seasons of the summer, the results suggested there exist potential differences in season not detected by ordination (perMANOVA p-value=0.009); however, the results also suggested there were no significant differences due to treatment (perMANOVA p-value=0.206). |
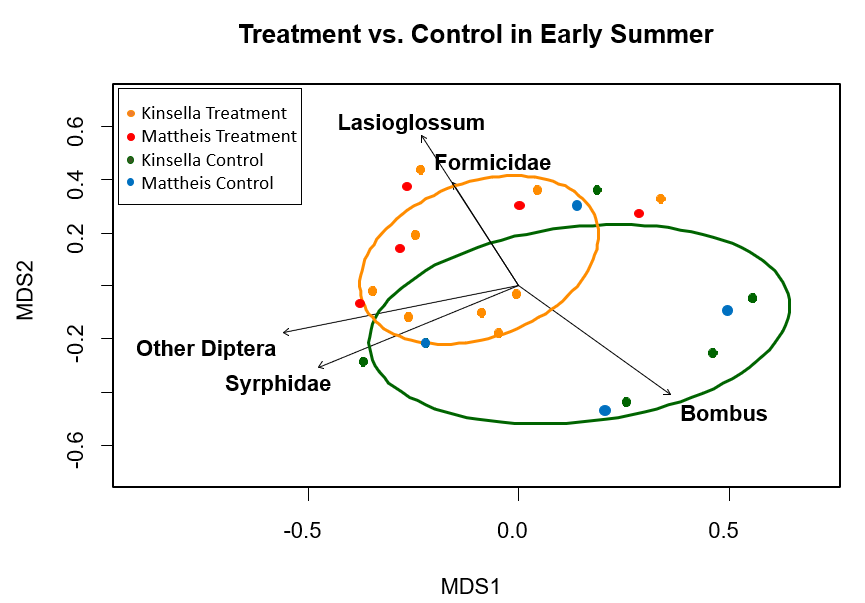
Figure 4. MetaMDS ordination for statistically significant pollinator groups (p ≤ 0.03), clustered by honeybee treatment and control in the early season (June) where Orange=Honeybee treatment and Green=Control. Each point is a transect. Calculated using the Bray Curtis distance method. Stress value=0.22, r2=0.55.
|
Across the mid summer season, significant differences in pollinator composition did not occur between treatment and control, indicating no apparent treatment effect (Figure 5). The significant (p ≤ 0.03) pollinator groups were two genera of bee, Colletes and Megachile, which were not closely associated but both of near-equal importance (Figure 5). Across the late summer season, significant differences in pollinator composition did not occur between treatment and control, indicating no apparent treatment effect (Figure 6). The significant (p ≤ 0.03) pollinator groups were again flies, Diptera, Syrphidae, and Bombyliidae (Figure 6).
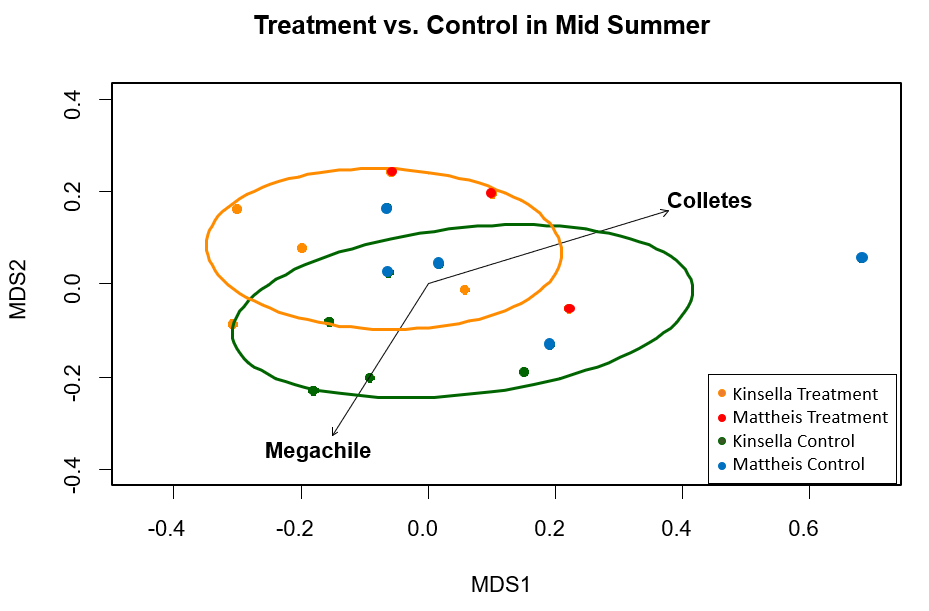
Figure 5. MetaMDS ordination for statistically significant pollinator groups (p ≤ 0.03), clustered by honeybee treatment and control in the mid season (July) where Orange=Honeybee treatment and Green=Control. Each point is a transect. Calculated using the Bray Curtis distance method. Stress value=0.25, r2=0.48.
|
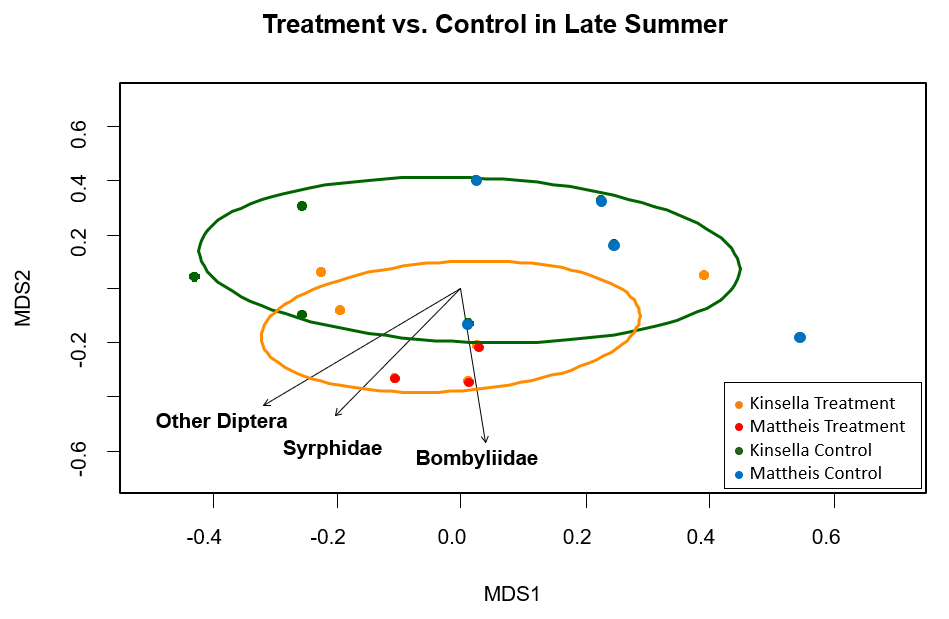
Figure 6. MetaMDS ordination for statistically significant pollinator groups (p ≤ 0.03), clustered by honeybee treatment and control in the late season (August, September) where Orange=Honeybee treatment and Green=Control. Each point is a transect. Calculated using the Bray Curtis distance method. Stress value=0.28, r2=0.51.
|
To test the variances and correlations between groups rather than within, canonical discriminant analysis was completed (Figure 7). Various packages (dplyr, tidyr, candisc, MASS, ggplot2) were employed to analyze and visualize the data. The significant (p ≤ 0.03) pollinator groups were flies, Diptera, Syprhidae, and Bombyliidae, ants, Formicidae, and a four genera of bee, Lasioglossum, Bombus, Colletes and Megachile. Function 1 of the model explained a moderate amount of the variance (66%), indicating some effect of treatment and season on pollinator composition. Function 2 was relatively low (24.4%). The model revealed some differences in late season treatment, as the cluster had no overlap with other clusters. Late season control and early season treatment had only moderate overlap with other clusters, while early season control and mid season control centroids entirely overlapped. The pollinator groups Bombyliidae, Syrphidae, Lasioglossum and Bombus had the longest vectors, showing high importance in separating the data (Figure 7).
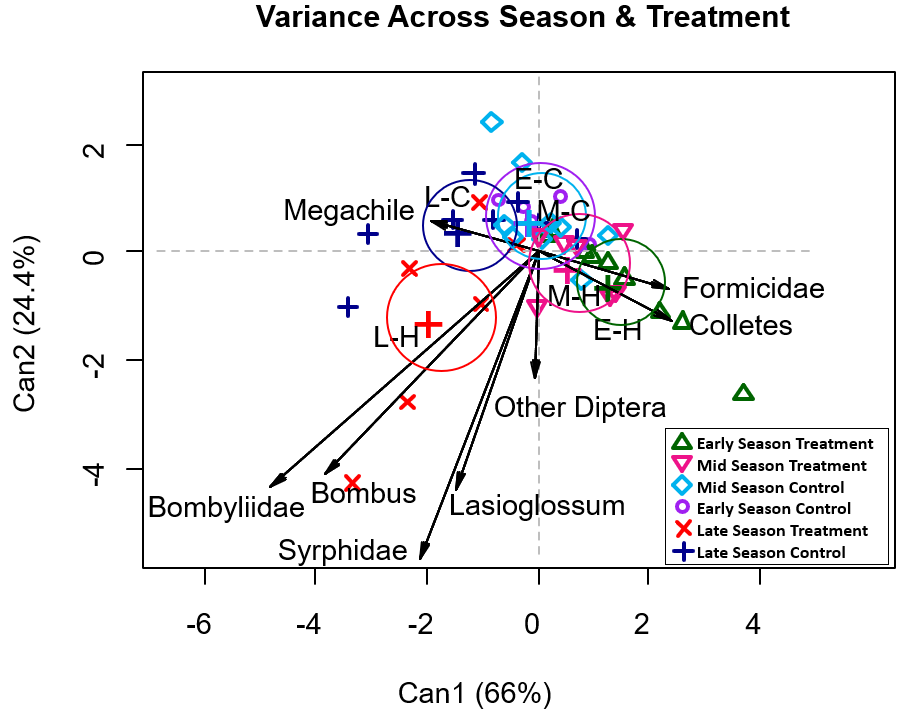
Figure 7. Canonical discriminant analysis for statistically significant pollinator groups (p ≤ 0.03), paired by treatment/control across seasons. Each point is a paired season and treatment/control, clustered by colour in ellipses. Cluster centroids are indicated by large plus symbols (+).
|
Discussion
Catch rate increased after August 22 in the mixed prairie region, which may be due to the presence of canola, a mass-flowering crop (MFC), in the region at the time of sampling. MFCs bloom in high abundance and attract insects away from semi-natural habitat; following bloom, cross-habitat spillover, the mass movement of organisms between habitats, can occur (González-Varo & Vilà, 2017; Holzchuh et al., 2016). The data indicate potential trends in pollinator movement in agroecosystems, which could direct future study in this region.
The data used in this analysis was incomplete taxonomically, and may explain why flies were commonly the statistically significant pollinators. Bees (clade Anthophila) were classed to Genus, but flies were to Family or Order level, which may heighten their value statistically. Nevertheless, Dipteran groups were highly associated and should be examined as important pollinators alongside Hymenoptera. Two infrequent pollinator groups (Odonata, Orthoptera) are not obligate pollinators, and may have been present on flowers likely by chance, or to consume nectar. To augment future studies, further examination of the specimens is needed. Additionally, the honeybee hives placed on the ranches must be adjusted in future study. Typically, honeybees forage within 500 – 1000 m of their hive, and can travel as far as 5 km, though very few individuals travel farther than 2.5 km from the hive (Hagler et al., 2011). However, numerous times throughout the season, honeybees were found in considerable numbers on control transects. Though these could be feral hives, as no managed hives are within 13 miles of the ranch, control transects should be moved to distances of at least 5 km away from treatment hives in future study.
The ordination results indicated a treatment effect only in parkland, though perMANOVA results indicate some treatment effect on pollinator composition. Canonical discriminant analysis discovered some potential treatment effect in the late season and early season. Though there is some indication of treatment effect, the data suggest that at a coarse scale, there is no effect of honeybees on pollinator group composition; the data, however, demands further taxonomic categorization and future study requires control transects be placed at further distances from hives. Upon completion, this research will contribute to the landscape-scale understanding of pollinator communities in central and southern Alberta, and inform future management of honeybees in agroecosystems.
References
Friendly, M. & Fox, J. (2017). candisc: Visualizing Generalized Canonical Discriminant and Canonical Correlation Analysis. R package version 0.80. https://CRAN.R-project.org/package=candisc
González-Varo, J. & Vilà, M. (2017). Spillover of managed honeybees from mass-flowering crops into natural habitats. Biological Conservation, 212: 376-382.
Goslee, S., & Urban, D. (2007). ecodist: The ecodist package for dissimilarity-based analysis of ecological data. Journal of Statistical Software 22(7):1-19.
Hagler, J., et al. (2011). Foraging range of honey bees, Apis mellifera, in alfalfa seed production fields. Journal of Insect Science 11: 1–12.
Holzchuh, A., et al. (2016). Mass-flowering crops dilute pollinator abundance in agricultural landscapes across Europe. Ecology Letters 19: 1228-1236.
Oksanen, J., et al. (2019). vegan: Community Ecology Package. R package version 2.5-4. https://CRAN.R-project.org/package=vegan
RStudio Team (2015). RStudio: Integrated Development for R. RStudio, Inc., Boston, MA URL http://www.rstudio.com/.
Venables, W., & Ripley, B. (2002). MASS: Modern Applied Statistics with S. Fourth Edition. Springer, New York. ISBN 0-387-95457-0
Wickham, H., et al. (2019). dplyr: A Grammar of Data Manipulation. R package version 0.8.0.1. https://CRAN.R project.org/package=dplyr
Wickham, H., & Henry, L. (2018). tidyr: Easily Tidy Data with 'spread()' and 'gather()' Functions. R package version 0.8.2. https://CRAN.R-project.org/package=tidyr
Wickham, H. (2016). ggplot2: Elegant Graphics for Data Analysis. Springer-Verlag New York.
