Data Exploration
Data was collected over the 2018 summer field season from June 6 to September 6, yielding 959 specimens with recorded interactions with flowers. 594 specimens were recorded from Mattheis, and 365 were recorded from Kinsella. All bees (clade Anthophila) were identified to Genus level, with the exception of Apis mellifera and Macropis nuda, the only species for these genera in Alberta. A total of 17 genera of bees were found. Other pollinators were grouped to Order or Family level, giving a total of 27 pollinator groups with the inclusion of bee genera.
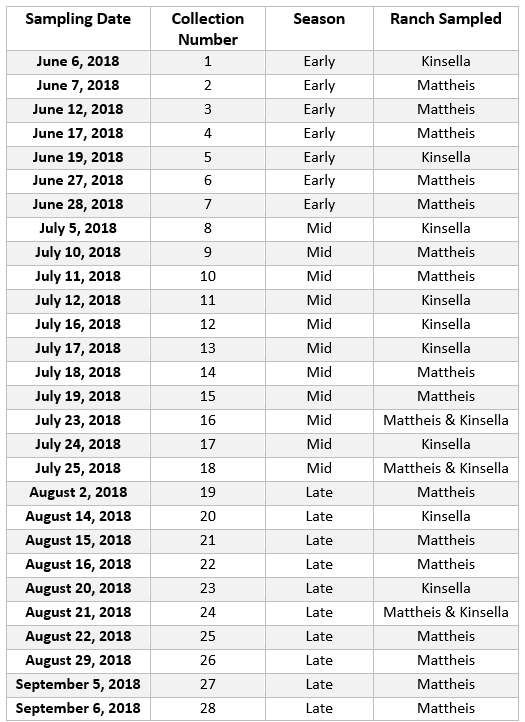
Table 1. Sampling days ordered from 1 to 28 throughout the 2018 field season.
|
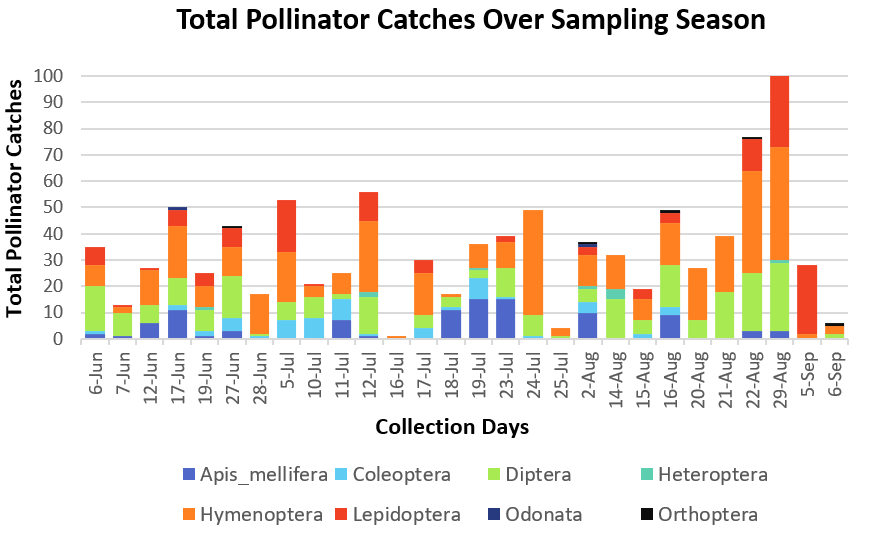
Figure 1. Number of individual pollinators caught per major pollinator group (Hymenoptera, Lepidoptera, Diptera, Apis mellifera, Orthoptera, Odonata, Coleoptera, Heteroptera) on each collection day.
|
Data was first sorted so that each sampling date was given a value from 1 to 28, and the dates were then further divided into Early, Mid, and Late summer seasons (Table 1). Pollinator groups were visually analyzed for trends through the collection dates by creating a bar plot, though ants, wasps, and the 17 bee genera, excluding Apis mellifera, were lumped together within Hymenoptera for visual clarity (Figure 1). Across the entire sampling period, and between the three seasons (Early, Mid, & Late), there was variation in abundance between the 27 pollinator groups. Most notably, catch rate increased after August 22 in the mixed prairie region (Figure 1).
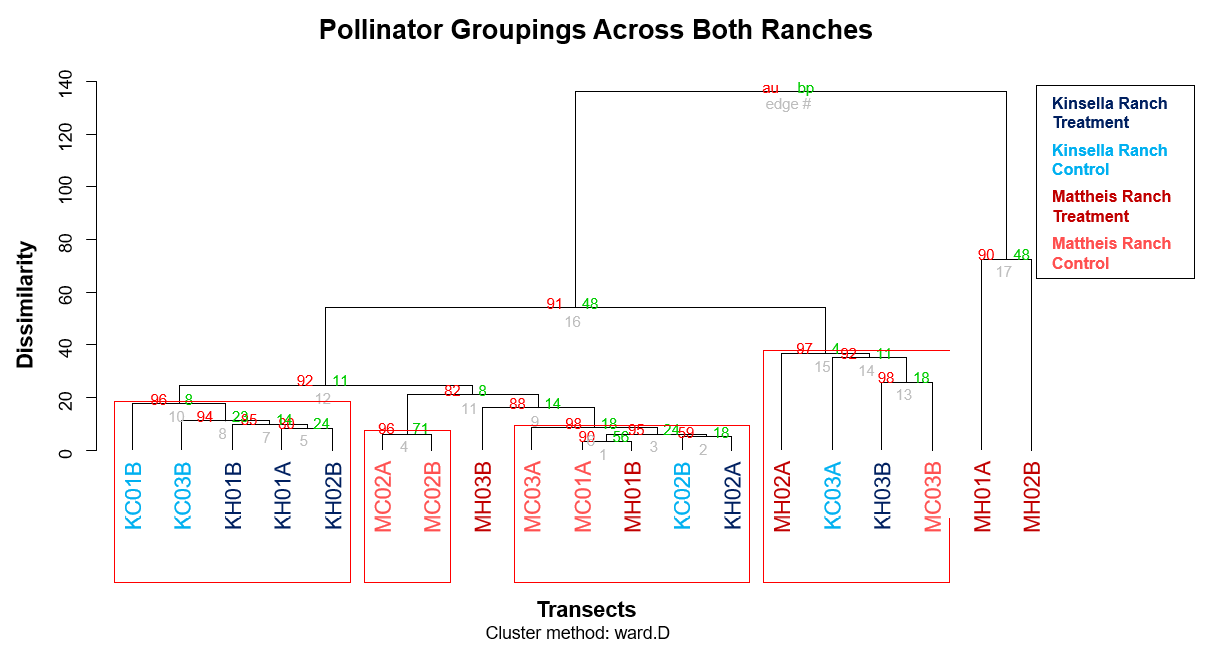
Figure 2. Cluster dendrogram highlighting the dissimilarities between transects across both regions.
|
Various code (head, str, summary) was used in RStudio to check for errors in the data before analysis, such as unwanted spaces, spelling errors, or anomalies in the values. After inputting the data, several packages (ecodist, pvclust) were employed to create hierarchical cluster dendrograms, showing the dissimilarities between transects and naturally significant groupings (Figure 2). Figure 2 highlights the similarities between the control transects and treatment transects across both regions, which are clustered hierarchically. Clusters with high Approximately Unbiased P-values are strongly supported by the data and are represented by four red boxes, though there did not appear to be any effect of treatment in the naturally significant groupings (Figure 2).
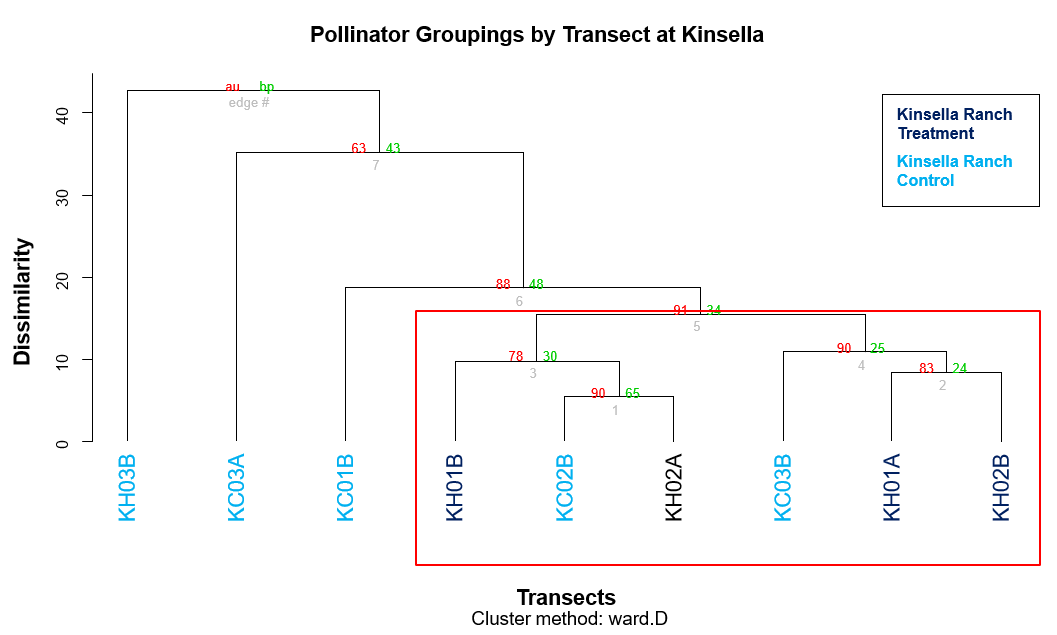
Figure 3. Cluster dendrogram highlighting the dissimilarities between transects at Kinsella.
|
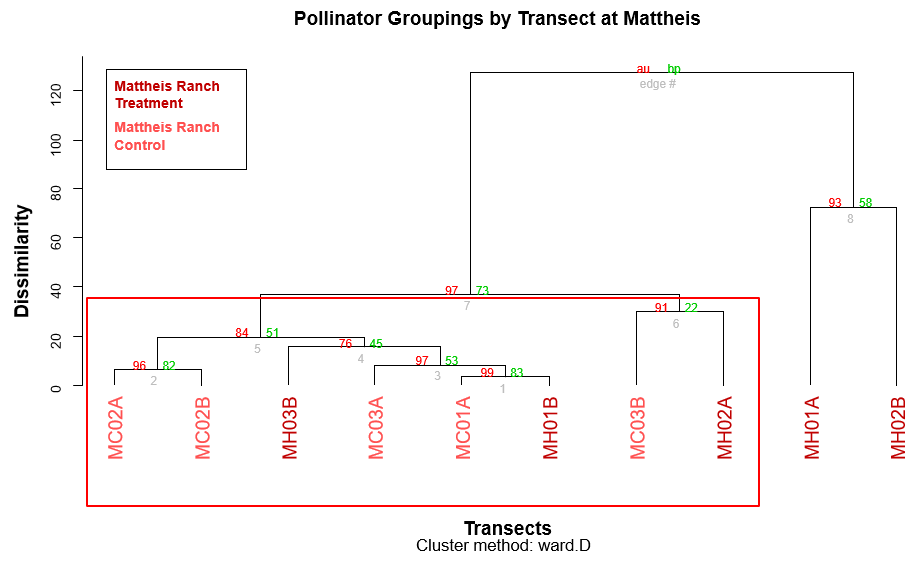
Figure 4. Cluster dendrogram highlighting the dissimilarities between transects at Mattheis.
|
To find potential differences in clustering within each region, two more cluster dendrograms, one for Kinsella and one for Mattheis, were created (Figures 3, 4). Clusters with high Approximately Unbiased P-values are strongly supported by the data and are represented by a red box. Here, the data indicated there was no apparent treatment effect (Figures 3, 4). After these analyses, because the data is non-normal, metaMDS, perMANOVA, and canonical discriminant analysis will be used to test the differences between sampling season and regions to see if the distributions are statistically significant.
References
González-Varo, J. & Vilà, M. (2017). Spillover of managed honeybees from mass-flowering crops into natural habitats. Biological Conservation, 212: 376-382.
Goslee, S., & Urban, D. (2007). ecodist: The ecodist package for dissimilarity-based analysis of ecological data. Journal of Statistical Software 22(7):1-19.
Holzchuh, A., et al. (2016). Mass-flowering crops dilute pollinator abundance in agricultural landscapes across Europe. Ecology Letters 19: 1228-1236.
Suzuki, R. & Shimodaira, H. (2015). pvclust: Hierarchical Clustering with P-Values via Multiscale Bootstrap Resampling. R package version 2.0-0. https://CRAN.R-project.org/package=pvclust
RStudio Team (2015). RStudio: Integrated Development for R. RStudio, Inc., Boston, MA URL http://www.rstudio.com/.
